| |
Input
/ Output |
Actual |
Target |
Potential
Improvement |
| Input |
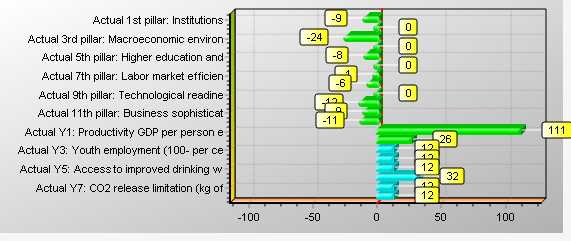
Actual 1st pillar: Institutions |
3.86 |
3.49 |
-9.5% |
|
Actual 2nd pillar: Infrastructure |
3.49 |
3.48 |
-0.4% |
|
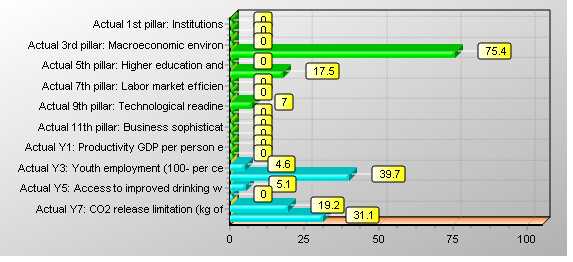
Actual 3rd pillar: Macroeconomic environ |
5.76 |
4.34 |
-24.6% |
|
Actual 4th pillar: Health and primary ed |
5.41 |
5.41 |
0.0% |
|
Actual 5th pillar: Higher education and |
4.45 |
4.07 |
-8.5% |
|
Actual 6th pillar: Goods market efficien |
4.32 |
4.32 |
0.0% |
|
Actual 7th pillar: Labor market efficien |
4.03 |
3.95 |
-1.9% |
|
Actual 8th pillar: Fi-10ncial market dev |
4.37 |
4.09 |
-6.5% |
|
Actual 9th pillar: Technological readine |
3.78 |
3.78 |
0.0% |
|
Actual 10th pillar: Market size |
4.68 |
4.12 |
-12.0% |
|
Actual 11th pillar: Business sophisticat |
4.33 |
3.91 |
-9.8% |
|
Actual 12th pillar: Innovation |
3.48 |
3.07 |
-11.9% |
| Output |
Actual Y1: Productivity GDP per person e |
8667.00 |
18351.97 |
111.7% |
|
Actual Y2: Equality of the income distri |
57.02 |
72.35 |
26.9% |
|
Actual Y3: Youth employment (100- per ce |
82.37 |
92.47 |
12.3% |
|
Actual Y4: Access to sanitation (per cen |
74.00 |
83.07 |
12.3% |
|
Actual Y5: Access to improved drinking w |
92.00 |
103.28 |
12.3% |
|
Actual Y6: Agricultural water conservati |
1.67 |
2.21 |
32.2% |
|
Actual Y7: CO2 release limitation (kg of |
2.99 |
3.36 |
12.3% |
|
Actual Y8: Forest cover conservation (ca |
98.10 |
110.13 |
12.3% |