| |
Input
/ Output |
Actual |
Target |
Potential
Improvement |
| Input |
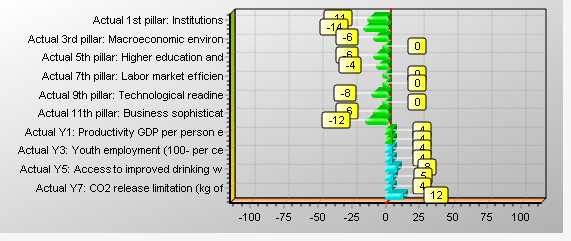
Actual 1st pillar: Institutions |
5.53 |
4.88 |
-11.7% |
|
Actual 2nd pillar: Infrastructure |
6.25 |
5.35 |
-14.4% |
|
Actual 3rd pillar: Macroeconomic environ |
5.38 |
5.01 |
-6.9% |
|
Actual 4th pillar: Health and primary ed |
6.64 |
6.64 |
0.0% |
|
Actual 5th pillar: Higher education and |
5.99 |
5.59 |
-6.7% |
|
Actual 6th pillar: Goods market efficien |
5.34 |
5.12 |
-4.2% |
|
Actual 7th pillar: Labor market efficien |
4.73 |
4.73 |
0.0% |
|
Actual 8th pillar: Fi-10ncial market dev |
4.55 |
4.55 |
0.0% |
|
Actual 9th pillar: Technological readine |
6.00 |
5.51 |
-8.2% |
|
Actual 10th pillar: Market size |
5.07 |
5.07 |
0.0% |
|
Actual 11th pillar: Business sophisticat |
5.57 |
5.19 |
-6.8% |
|
Actual 12th pillar: Innovation |
5.25 |
4.59 |
-12.6% |
| Output |
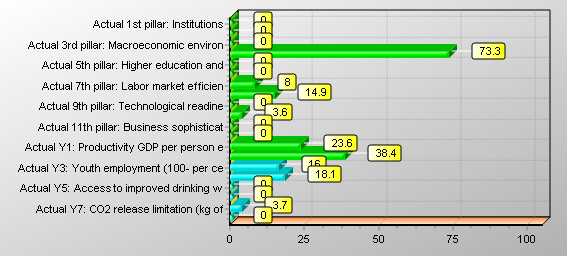
Actual Y1: Productivity GDP per person e |
46691.00 |
48606.51 |
4.1% |
|
Actual Y2: Equality of the income distri |
74.60 |
77.66 |
4.1% |
|
Actual Y3: Youth employment (100- per ce |
90.52 |
94.23 |
4.1% |
|
Actual Y4: Access to sanitation (per cen |
100.00 |
104.10 |
4.1% |
|
Actual Y5: Access to improved drinking w |
100.00 |
108.52 |
8.5% |
|
Actual Y6: Agricultural water conservati |
3.27 |
3.47 |
6.0% |
|
Actual Y7: CO2 release limitation (kg of |
2.82 |
2.94 |
4.1% |
|
Actual Y8: Forest cover conservation (ca |
98.30 |
110.73 |
12.6% |