| |
Input
/ Output |
Actual |
Target |
Potential
Improvement |
| Input |
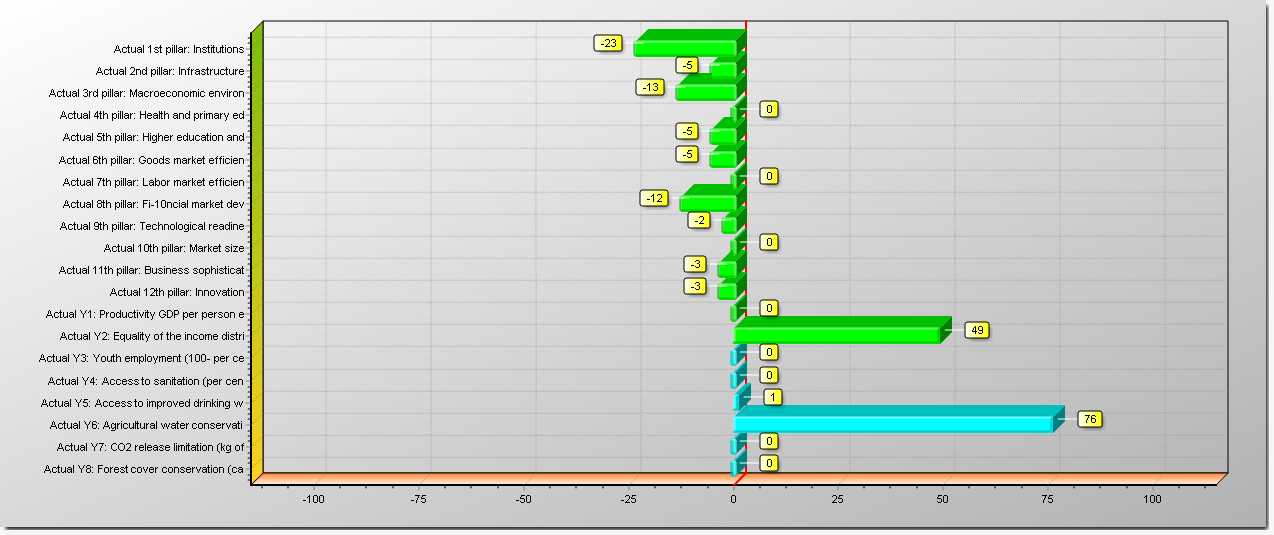
Actual 1st pillar: Institutions |
4.82 |
3.70 |
-23.3% |
|
Actual 2nd pillar: Infrastructure |
4.56 |
4.33 |
-5.1% |
|
Actual 3rd pillar: Macroeconomic environ |
5.88 |
5.10 |
-13.3% |
|
Actual 4th pillar: Health and primary ed |
5.75 |
5.75 |
0.0% |
|
Actual 5th pillar: Higher education and |
5.09 |
4.82 |
-5.4% |
|
Actual 6th pillar: Goods market efficien |
4.68 |
4.42 |
-5.5% |
|
Actual 7th pillar: Labor market efficien |
4.36 |
4.36 |
0.0% |
|
Actual 8th pillar: Fi-10ncial market dev |
4.88 |
4.26 |
-12.7% |
|
Actual 9th pillar: Technological readine |
4.59 |
4.48 |
-2.5% |
|
Actual 10th pillar: Market size |
4.50 |
4.50 |
0.0% |
|
Actual 11th pillar: Business sophisticat |
4.23 |
4.10 |
-3.2% |
|
Actual 12th pillar: Innovation |
3.54 |
3.41 |
-3.7% |
| Output |
Actual Y1: Productivity GDP per person e |
33758.00 |
34061.56 |
0.9% |
|
Actual Y2: Equality of the income distri |
47.94 |
71.88 |
49.9% |
|
Actual Y3: Youth employment (100- per ce |
83.33 |
84.08 |
0.9% |
|
Actual Y4: Access to sanitation (per cen |
99.00 |
99.89 |
0.9% |
|
Actual Y5: Access to improved drinking w |
99.00 |
100.56 |
1.6% |
|
Actual Y6: Agricultural water conservati |
1.79 |
3.17 |
76.9% |
|
Actual Y7: CO2 release limitation (kg of |
2.66 |
2.68 |
0.9% |
|
Actual Y8: Forest cover conservation (ca |
101.70 |
102.61 |
0.9% |