| |
Input
/ Output |
Actual |
Target |
Potential
Improvement |
| Input |
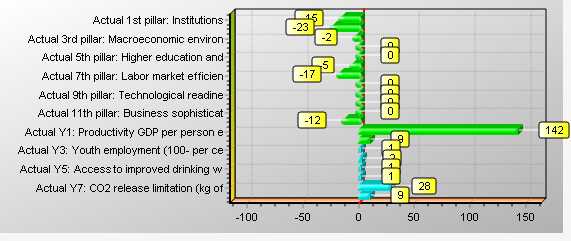
Actual 1st pillar: Institutions |
3.51 |
2.98 |
-15.2% |
|
Actual 2nd pillar: Infrastructure |
3.74 |
2.86 |
-23.5% |
|
Actual 3rd pillar: Macroeconomic environ |
4.66 |
4.53 |
-2.7% |
|
Actual 4th pillar: Health and primary ed |
5.86 |
5.83 |
-0.5% |
|
Actual 5th pillar: Higher education and |
3.74 |
3.74 |
0.0% |
|
Actual 6th pillar: Goods market efficien |
4.24 |
4.02 |
-5.1% |
|
Actual 7th pillar: Labor market efficien |
4.37 |
3.61 |
-17.3% |
|
Actual 8th pillar: Fi-10ncial market dev |
3.77 |
3.76 |
-0.1% |
|
Actual 9th pillar: Technological readine |
3.12 |
3.12 |
0.0% |
|
Actual 10th pillar: Market size |
4.69 |
4.69 |
0.0% |
|
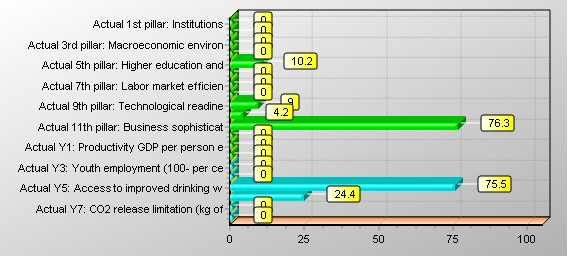
Actual 11th pillar: Business sophisticat |
3.58 |
3.58 |
0.0% |
|
Actual 12th pillar: Innovation |
3.12 |
2.73 |
-12.6% |
| Output |
Actual Y1: Productivity GDP per person e |
6272.00 |
15200.38 |
142.4% |
|
Actual Y2: Equality of the income distri |
64.43 |
70.29 |
9.1% |
|
Actual Y3: Youth employment (100- per ce |
93.84 |
94.85 |
1.1% |
|
Actual Y4: Access to sanitation (per cen |
75.00 |
76.81 |
2.4% |
|
Actual Y5: Access to improved drinking w |
95.00 |
96.02 |
1.1% |
|
Actual Y6: Agricultural water conservati |
3.99 |
4.03 |
1.1% |
|
Actual Y7: CO2 release limitation (kg of |
2.45 |
3.14 |
28.4% |
|
Actual Y8: Forest cover conservation (ca |
96.40 |
105.91 |
9.9% |