| |
Input
/ Output |
Actual |
Target |
Potential
Improvement |
| Input |
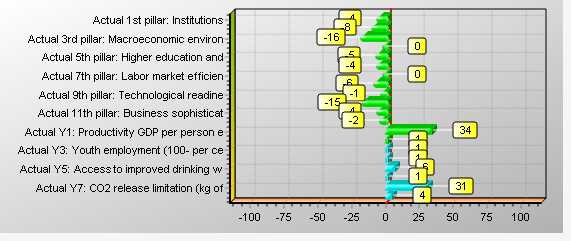
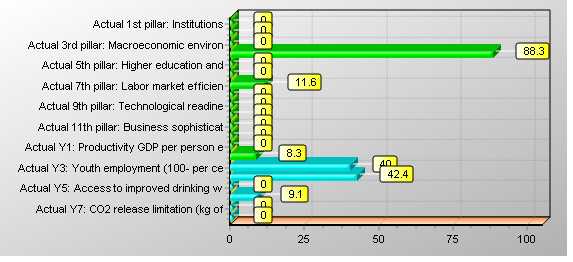
Actual 1st pillar: Institutions |
3.66 |
3.51 |
-4.1% |
|
Actual 2nd pillar: Infrastructure |
4.58 |
4.17 |
-9.0% |
|
Actual 3rd pillar: Macroeconomic environ |
6.01 |
5.02 |
-16.5% |
|
Actual 4th pillar: Health and primary ed |
5.80 |
5.80 |
0.0% |
|
Actual 5th pillar: Higher education and |
4.58 |
4.32 |
-5.6% |
|
Actual 6th pillar: Goods market efficien |
4.74 |
4.51 |
-4.9% |
|
Actual 7th pillar: Labor market efficien |
4.24 |
4.24 |
0.0% |
|
Actual 8th pillar: Fi-10ncial market dev |
4.61 |
4.30 |
-6.8% |
|
Actual 9th pillar: Technological readine |
3.94 |
3.87 |
-1.9% |
|
Actual 10th pillar: Market size |
5.09 |
4.32 |
-15.1% |
|
Actual 11th pillar: Business sophisticat |
4.40 |
4.22 |
-4.1% |
|
Actual 12th pillar: Innovation |
3.28 |
3.20 |
-2.4% |
| Output |
Actual Y1: Productivity GDP per person e |
16764.00 |
22525.57 |
34.4% |
|
Actual Y2: Equality of the income distri |
60.63 |
61.29 |
1.1% |
|
Actual Y3: Youth employment (100- per ce |
97.30 |
98.35 |
1.1% |
|
Actual Y4: Access to sanitation (per cen |
93.00 |
94.01 |
1.1% |
|
Actual Y5: Access to improved drinking w |
96.00 |
101.88 |
6.1% |
|
Actual Y6: Agricultural water conservati |
3.30 |
3.34 |
1.1% |
|
Actual Y7: CO2 release limitation (kg of |
2.49 |
3.28 |
31.7% |
|
Actual Y8: Forest cover conservation (ca |
97.50 |
102.14 |
4.8% |