| |
Input
/ Output |
Actual |
Target |
Potential
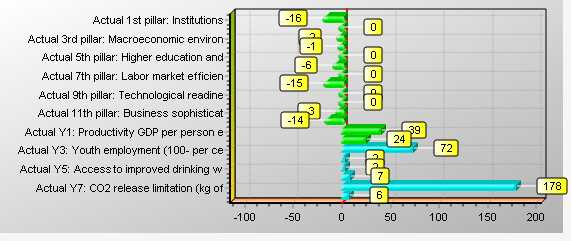
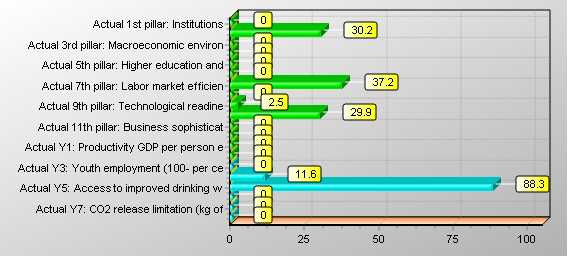
Improvement |
| Input |
Actual 1st pillar: Institutions |
4.26 |
3.57 |
-16.3% |
|
Actual 2nd pillar: Infrastructure |
3.73 |
3.73 |
0.0% |
|
Actual 3rd pillar: Macroeconomic environ |
4.93 |
4.78 |
-3.0% |
|
Actual 4th pillar: Health and primary ed |
5.64 |
5.58 |
-1.0% |
|
Actual 5th pillar: Higher education and |
4.32 |
4.29 |
-0.7% |
|
Actual 6th pillar: Goods market efficien |
4.64 |
4.32 |
-7.0% |
|
Actual 7th pillar: Labor market efficien |
4.21 |
4.21 |
0.0% |
|
Actual 8th pillar: Fi-10ncial market dev |
4.49 |
3.81 |
-15.1% |
|
Actual 9th pillar: Technological readine |
3.99 |
3.99 |
0.0% |
|
Actual 10th pillar: Market size |
2.91 |
2.91 |
0.0% |
|
Actual 11th pillar: Business sophisticat |
3.78 |
3.66 |
-3.3% |
|
Actual 12th pillar: Innovation |
3.28 |
2.82 |
-14.1% |
| Output |
Actual Y1: Productivity GDP per person e |
15882.00 |
22221.33 |
39.9% |
|
Actual Y2: Equality of the income distri |
56.44 |
69.99 |
24.0% |
|
Actual Y3: Youth employment (100- per ce |
46.09 |
79.54 |
72.6% |
|
Actual Y4: Access to sanitation (per cen |
91.00 |
92.83 |
2.0% |
|
Actual Y5: Access to improved drinking w |
99.00 |
100.99 |
2.0% |
|
Actual Y6: Agricultural water conservati |
2.35 |
2.52 |
7.2% |
|
Actual Y7: CO2 release limitation (kg of |
1.23 |
3.43 |
178.8% |
|
Actual Y8: Forest cover conservation (ca |
97.50 |
104.25 |
6.9% |