| |
Input
/ Output |
Actual |
Target |
Potential
Improvement |
| Input |
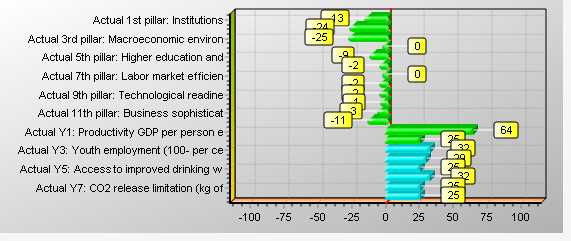
Actual 1st pillar: Institutions |
4.11 |
3.54 |
-13.8% |
|
Actual 2nd pillar: Infrastructure |
4.37 |
3.31 |
-24.2% |
|
Actual 3rd pillar: Macroeconomic environ |
5.48 |
4.11 |
-25.1% |
|
Actual 4th pillar: Health and primary ed |
5.67 |
5.67 |
0.0% |
|
Actual 5th pillar: Higher education and |
4.53 |
4.10 |
-9.6% |
|
Actual 6th pillar: Goods market efficien |
4.54 |
4.44 |
-2.3% |
|
Actual 7th pillar: Labor market efficien |
3.81 |
3.81 |
0.0% |
|
Actual 8th pillar: Fi-10ncial market dev |
4.45 |
4.33 |
-2.7% |
|
Actual 9th pillar: Technological readine |
3.58 |
3.51 |
-2.1% |
|
Actual 10th pillar: Market size |
5.34 |
5.25 |
-1.7% |
|
Actual 11th pillar: Business sophisticat |
4.47 |
4.31 |
-3.6% |
|
Actual 12th pillar: Innovation |
3.93 |
3.46 |
-11.9% |
| Output |
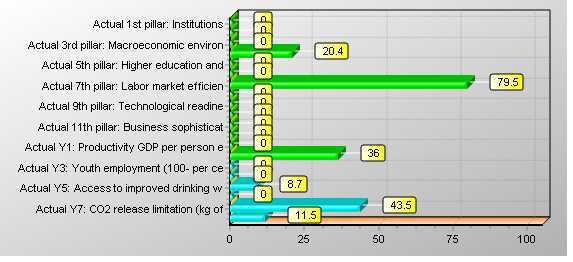
Actual Y1: Productivity GDP per person e |
11461.00 |
18866.86 |
64.6% |
|
Actual Y2: Equality of the income distri |
61.86 |
77.55 |
25.4% |
|
Actual Y3: Youth employment (100- per ce |
78.36 |
104.16 |
32.9% |
|
Actual Y4: Access to sanitation (per cen |
59.00 |
76.13 |
29.0% |
|
Actual Y5: Access to improved drinking w |
85.00 |
106.55 |
25.4% |
|
Actual Y6: Agricultural water conservati |
1.74 |
2.30 |
32.1% |
|
Actual Y7: CO2 release limitation (kg of |
2.95 |
3.70 |
25.4% |
|
Actual Y8: Forest cover conservation (ca |
94.50 |
118.46 |
25.4% |