| |
Input
/ Output |
Actual |
Target |
Potential
Improvement |
| Input |
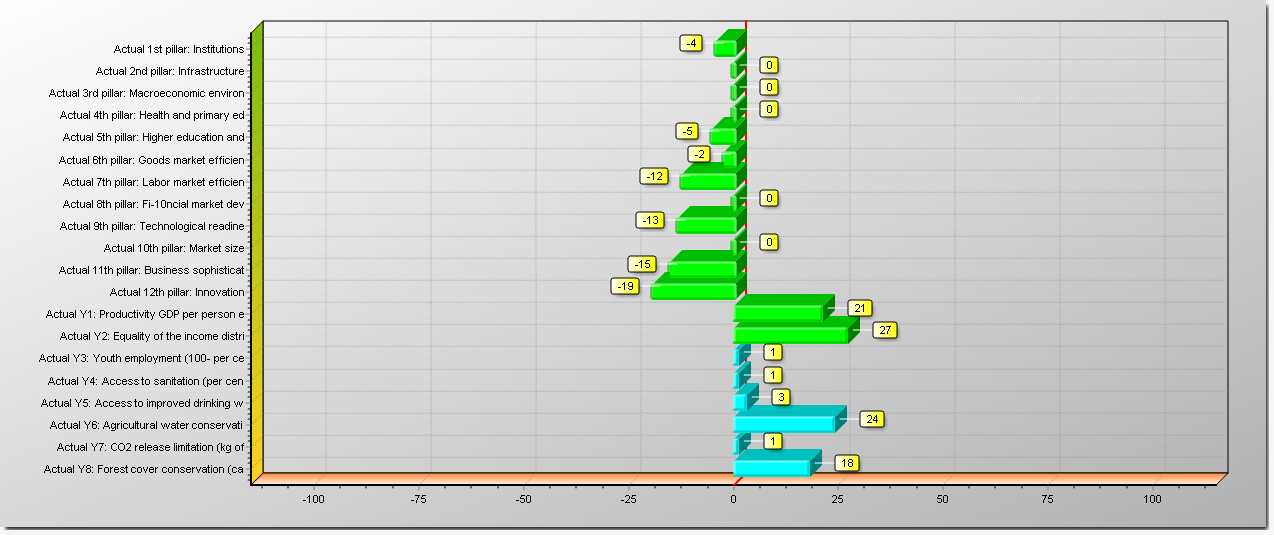
Actual 1st pillar: Institutions |
4.26 |
4.08 |
-4.2% |
|
Actual 2nd pillar: Infrastructure |
4.08 |
4.07 |
-0.1% |
|
Actual 3rd pillar: Macroeconomic environ |
4.40 |
4.40 |
0.0% |
|
Actual 4th pillar: Health and primary ed |
6.06 |
6.06 |
0.0% |
|
Actual 5th pillar: Higher education and |
5.00 |
4.73 |
-5.4% |
|
Actual 6th pillar: Goods market efficien |
4.47 |
4.36 |
-2.5% |
|
Actual 7th pillar: Labor market efficien |
4.29 |
3.75 |
-12.5% |
|
Actual 8th pillar: Fi-10ncial market dev |
3.74 |
3.74 |
0.0% |
|
Actual 9th pillar: Technological readine |
4.77 |
4.11 |
-13.9% |
|
Actual 10th pillar: Market size |
3.43 |
3.43 |
0.0% |
|
Actual 11th pillar: Business sophisticat |
4.49 |
3.81 |
-15.1% |
|
Actual 12th pillar: Innovation |
3.78 |
3.05 |
-19.4% |
| Output |
Actual Y1: Productivity GDP per person e |
18913.00 |
23000.89 |
21.6% |
|
Actual Y2: Equality of the income distri |
49.27 |
62.75 |
27.4% |
|
Actual Y3: Youth employment (100- per ce |
81.58 |
82.92 |
1.6% |
|
Actual Y4: Access to sanitation (per cen |
94.00 |
95.54 |
1.6% |
|
Actual Y5: Access to improved drinking w |
97.00 |
100.70 |
3.8% |
|
Actual Y6: Agricultural water conservati |
3.06 |
3.82 |
24.9% |
|
Actual Y7: CO2 release limitation (kg of |
3.33 |
3.38 |
1.6% |
|
Actual Y8: Forest cover conservation (ca |
96.80 |
115.01 |
18.8% |